Post-Editorial Note (Nov 8, 2025)
This post exploded on Hacker News and Lobsters. 🔥
The response was largely positive, which surprised me. I guess the industry is further along into this trend than what I thought!
Inevitably, I got some heat too! A fair amount of it came from Kafka vendors invested in the space. I wrote a few FAQs addressing some of the pushback it received. I happily concede some points and but also clear up a lot of points that are misunderstood. Scroll to the bottom to see it: 👉 # Post-Editorial Note
Intro
I feel like the tech world lives in two camps.
- One camp chases buzzwords.
This camp tends to adopt whatever’s popular without thinking hard about whether it’s appropriate. They tend to fall for all the purported benefits the sales pitch gives them - real-time, infinitely scale, cutting-edge, cloud-native, serverless, zero-trust, AI-powered, etc.
You see this everywhere in the Kafka world: Streaming Lakehouse™️, Kappa™️ Architecture, Streaming AI Agents1.
This phenomenon is sometimes known as resume-driven design. It can also be a scale cargo-cult. Modern practices actively encourage both. Consultants push “innovative architectures” stuffed with vendor tech via “insight” reports2. System design interviews expect you to design Google-scale architectures that are inevitably at a scale 100x higher than the company you’re interviewing for would ever need. Career progression rewards you for replatforming to the Hot New Stack™️, not for being resourceful.
- The other camp chases common sense
This camp is far more pragmatic. They strip away unnecessary complexity and steer clear of overengineered solutions. They reason from first principles before making technology choices. They resist marketing hype and approach vendor claims with healthy skepticism.
Historically, it has felt like Camp 1 definitively held the upper hand in sheer numbers and noise. Today, it feels like the pendulum may be beginning to swing back, at least a tiny bit. Two recent trends are on the side of Camp 2:
Trend 1 - the “Small Data” movement. People are realizing two things - their data isn’t that big and their computers are becoming big too. You can rent a 128-core, 4 TB of RAM instance from AWS. AMD just released 192-core CPUs this summer. That ought to be enough for anybody.3
Trend 2 - the Postgres Renaissance. The space is seeing incredible growth and investment4. In the last 2 years, the phrase “Just Use Postgres (for everything)” has gained a ton of popularity. The basic premise is that you shouldn’t complicate things with new tech when you don’t need to, and that Postgres alone solves most problems pretty well. Postgres competes with purpose-built solutions like:
- Elasticsearch (functionality supported by Postgres’
tsvector/tsquery) - MongoDB (
jsonb) - Redis (
CREATE UNLOGGED TABLE) - AI Vector Databases (
pgvector,pgai) - Snowflake / OLAP (
pg_lake,pg_duckdb,pg_mooncake)
and… Kafka (this blog).
The claim isn’t that Postgres is functionally equivalent to any of these specialized systems. The claim is that it handles 80%+ of their use cases with 20% of the development effort. (Pareto Principle)
When you combine the two trends, the appeal becomes obvious. Postgres is a battle-tested, well-known system that is simple, scalable and reliable. Pair it with today’s powerful hardware and you quickly begin to realize that, more often than not, you do not need the state-of-the-art highly optimized and complex distributed system in order to handle your organization’s scale.
Despite being somebody who is biased towards Kafka, I tend to agree. Kafka is similar to Postgres in that it’s stable, mature, battle-tested and boasts a strong community. It also scales a lot further. Despite that, I don’t think it’s the right choice for a lot of cases. Very often I see it get adopted where it doesn’t make sense.
A 500 KB/s workload should not use Kafka. There is a scalability cargo cult in tech that always wants to choose “the best possible” tech for a problem - but this misses the forest for the trees. The “best possible” solution frequently isn’t a technical question - it’s a practical one. Adriano makes an airtight case for why you should opt for simple tech in his PG as Queue blog (2023) that originally inspired me to write this.
Enough background. In this article, we will do three simple things:
- Benchmark how far Postgres can scale for pub/sub messaging - # PG as a Pub/Sub
- Benchmark how far Postgres can scale for queueing - # PG as a Queue
- Concisely touch upon when Postgres can be a fit for these use cases - # Should You Use Postgres?
I am not aiming for an exhaustive in-depth evaluation. Benchmarks are messy af. Rather, my goal is to publish some reasonable data points which can start a discussion.
(while this article is for Postgres, feel free to replace it with your database of choice)
Results TL;DR
If you’d like to skip straight to the results, here they are:
🔥 The Benchmark Results
Pub-Sub Results
| Setup | ✍️ Write | 📖 Read | 🔭 e2e Latency5 (p99) | Notes |
|---|---|---|---|---|
| 1× c7i.xlarge | 4.8 MiB/s 5036 msg/s | 24.6 MiB/s 25 183 msg/s (5x fanout) | 60 ms | ~60 % CPU; 4 partitions |
| 3× c7i.xlarge (replicated) | 4.9 MiB/s 5015 msg/s | 24.5 MiB/s 25 073 msg/s (5x fanout) | 186 ms | ~65 % CPU; cross-AZ RF≈2.5; 4 partitions |
| 1× c7i.24xlarge | 238 MiB/s 243,000 msg/s | 1.16 GiB/s 1,200,000 msg/s (5x fanout) | 853 ms | ~10 % CPU (idle); 30 partitions |
Queue Results
| Setup | 📬 Throughput (read + write) | 🔭 e2e Latency5 (p99) | Notes |
|---|---|---|---|
| 1× c7i.xlarge | 2.81 MiB/s 2885 msg/s | 17.7 ms | ~60 % CPU; read-client bottleneck |
| 3× c7i.xlarge (replicated) | 2.34 MiB/s 2397 msg/s | 920 ms ⚠️6 | replication lag inflated E2E latency |
| 1× c7i.24xlarge | 19.7 MiB/s 20,144 msg/s | 930 ms ⚠️6 | ~50 % CPU; single-table bottleneck |
Make sure to at least read the last section of the article where we philosophize - # Should You Use Postgres?
PG as a Pub/Sub
There are dozens of blogs out there using Postgres as a queue, but interestingly enough I haven’t seen one use it as a pub-sub messaging system.
A quick distinction between the two because I often see them get confused:
-
Queues are meant for point-to-point communication. They’re widely used for asynchronous background jobs: worker apps (clients) process a task in the queue like sending an e-mail or pushing a notification. The event is consumed once and it’s done with. A message is immediately deleted (popped) off the queue once it’s consumed. Queues do not have strict ordering guarantees7.
-
Pub-sub messaging differs from the queue in that it is meant for one-to-many communication. This inherently means there is a large read fanout - more than one reader client is interested in any given message. Good pub-sub systems decouple readers from writers by storing data on disks. This allows them to not impose a max queue depth limit - something in-memory queues need to do in order to prevent them from going OOM.
There is also a general expectation that there is strict order - events should be read in the same order that they arrived in the system.
Postgres’ main competitor here is Kafka, which is the standard in pub-sub today. Various (mostly-proprietary) alternatives exist.8
Kafka uses the Log data structure to hold messages. You’ll see my benchmark basically reconstructs a log from Postgres primitives.
Postgres doesn’t seem to have any popular libraries for pub-sub9 use cases, so I had to write my own. The Kafka-inspired workflow I opted for is this:
- Writers produce batches of messages per statement10 (
INSERT INTO). Each transaction carries one batch insert and targets a singletopicpartitiontable11 - Each writer is sticky to one table, but in aggregate they produce to multiple tables.
- Each message has a unique monotonically-increasing offset number. A specific row in a special
log_countertable denotes the latest offset for a giventopicpartitiontable. - Write transactions atomically update both the
topicpartitiondata and thelog_counterrow. This ensures consistent offset tracking across concurrent writers. - Readers poll for new messages. They consume the
topicpartitiontable(s) sequentially, starting from the lowest offset and progressively reading up. - Readers are split into consumer groups. Each group performs separate, independent reads and makes progress on the
topicpartitiontables. - Each group contains 1 reader per
topicpartitiontable. - Readers store their progress in a
consumer_offsetstable, with a row for eachtopicpartition,grouppair. - Each reader updates the latest processed offset (claiming the records), selects the records and processes them inside a single transaction.
This ensures Kafka-like semantics - gapless, monotonically-increasing offsets and at-least-once/at-most-once processing. This test in particular uses at-least-once semantics, but neither choice should impact the benchmark results.
Pub-Sub Setup
Table
CREATE TABLE log_counter (
  id           INT PRIMARY KEY, -- topicpartition table name id
  next_offset  BIGINT NOT NULL  -- next offset to assign
);

for i in NUM_PARTITIONS:
  CREATE TABLE topicpartition%d (
    id          BIGSERIAL PRIMARY KEY,
    -- strictly increasing offset (indexed by UNIQUE)
    c_offset    BIGINT UNIQUE NOT NULL,
    payload     BYTEA NOT NULL,
    created_at  TIMESTAMPTZ NOT NULL DEFAULT now()
  );
  INSERT INTO log_counter(id, next_offset) VALUES (%d, 1);

CREATE TABLE consumer_offsets (
  group_id     TEXT NOT NULL,     -- consumer group identifier
  -- topic-partition id (matches log_counter.id / topicpartitionN)
  topic_id     INT  NOT NULL,
  -- next offset the consumer group should claim
  next_offset  BIGINT NOT NULL DEFAULT 1,
  PRIMARY KEY (group_id, topic_id)
);
Writes
The benchmark runs N writer goroutines. These represent writer clients.
Each one loops and atomically inserts $BATCH_SIZE records while updating the latest offset:
WITH reserve AS (
  UPDATE log_counter
  SET next_offset = next_offset + $1
  WHERE id = $3::int
  RETURNING (next_offset - $1) AS first_off
)

INSERT INTO topicpartition%d(c_offset, payload)
SELECT r.first_off + p.ord - 1, p.payload
FROM reserve r,
     unnest($2::bytea[]) WITH ORDINALITY AS p(payload, ord);
Reads
The benchmark also runs N reader goroutines. Each reader is assigned a particular consumer group and partition. The group as a whole reads all partitions while each reader in the group reads only one partition at a time.
The reader loops, opens a transaction, optimistically claims $BATCH_SIZE records (by advancing the offset mark beyond them), selects them and processes the records.
If successful, it commits the transaction and through that advances the offset for the group.
It is a pull-based read (just like Kafka), rather than push-based. If the reader has no records to poll, it sleeps for a bit.
First it opens a transaction:
BEGIN TRANSACTIONThen it claims the offsets:
WITH counter_tip AS (
  SELECT (next_offset - 1) AS highest_committed_offset
  FROM log_counter
  WHERE id = $3::int -- partition id
),

-- select & lock the particular group<->topic_partition<->offset pair
to_claim AS (
  SELECT
    c.group_id,
    c.next_offset AS n0, -- old start offset pointer before update
    -- takes the min of the batch size
    -- or the current offset delta w.r.t the tip of the log
    LEAST(
      $2::bigint, -- BATCH_SIZE
      GREATEST(0,
        (SELECT highest_committed_offset FROM counter_tip) - c.next_offset + 1)
    ) AS delta
  FROM consumer_offsets c
  WHERE c.group_id = $1::text AND c.topic_id = $3::int
  FOR UPDATE
),

-- atomically select + update the offset
upd AS (
  UPDATE consumer_offsets c
  SET next_offset = c.next_offset + t.delta
  FROM to_claim t
  WHERE c.group_id = t.group_id AND c.topic_id = $3::int
  RETURNING
    t.n0 AS claimed_start_offset, -- start = the old next_offset
    (c.next_offset - 1) AS claimed_end_offset -- end   = new pointer - 1
)

SELECT claimed_start_offset, claimed_end_offset
FROM upd;
Followed by selecting the claimed records:
SELECT c_offset, payload, created_at
  FROM topicpartition%d
  WHERE c_offset BETWEEN $1 AND $2
  ORDER BY c_offset
Finally, the data gets processed by the business logic (no-op in our benchmark) and the transaction is closed:
COMMIT;If you’re wondering “why no NOTIFY/LISTEN?” - my understanding of that feature is that it’s an optimization and cannot be fully relied upon, so polling is required either way12. Given that, I just copied Kafka’s relatively simple design.
Pub-Sub Results
The full code and detailed results are all published on GitHub at stanislavkozlovski/pg-queue-pubsub-benchmark. I ran three setups - a single-node 4 vCPU, a 3-node replicated 4 vCPU and a single-node 96 vCPU setup. Here are the summarized results for each:
4 vCPU Single Node
The results are the average of three 2-minute tests. [full results link]
Setup:
- c7i.xlarge Postgres server /w 25GB gp3 9000 IOPS EBS volume
- mostly default Postgres settings (synchronous commit, fsync);
autovacuum_analyze_scale_factor = 0.05set on the partition tables too (unclear if it has an effect)
- each row’s payload is 1 KiB (1024 bytes)
- 4 topicpartition tables
- 10 writers (2 writers per partition on average)
- 5x read fanout via 5 consumer groups
- 20 reader clients total (4 readers per group)
- write batch size: 100 records
- read batch size: 200 records
Results:
-
write message rate: 5036 msg/s
-
write throughput: 4.8 MiB/s
-
write latency: 38.7ms p99 / 6.2ms p95
-
read message rate: 25,183 msg/s
-
read message throughput: 24.6 MiB/s
-
read latency: 27.3ms p99 (varied 8.9ms-47ms b/w runs); 4.67ms p95
-
end-to-end latency5: 60ms p99 / 10.6ms p95
-
server kept at ~60% CPU;
-
disk was at ~1200 writes/s with iostat claiming 46 MiB/s
These are pretty good results. It’s funny to think that the majority of people run a complex distributed system like Kafka for similar workloads13.
4 vCPU Tri-Node
Now, a replicated setup to more accurately mimic the durability and availability guarantees of Kafka.
The average of two 5-minute tests. [full results link]
Setup:
- 3x c7i.xlarge Postgres servers /w 25GB gp3 9000 IOPS EBS volume
- each on a separate AZ (us-east-1a, us-east-1b, us-east-1c)
- one
syncreplica and onepotential14 replica
- a few custom Postgres settings like
wal_compression,max_worker_processes,max_parallel_workers,max_parallel_workers_per_gatherand of course -hot_standbyautovacuum_analyze_scale_factor = 0.05set on the partition tables too (unclear if it has an effect)
- each row’s payload is 1 KiB (1024 bytes)
- 4 topicpartition tables
- 10 writers (2 writers per partition on average)
- 5x read fanout via 5 consumer groups
- readers only access the primary DB15; readers are in the same AZ as the primary;
- 20 reader clients total (4 readers per group)
- write batch size: 100 records
- read batch size: 200 records
Results:
-
write message rate: 5015 msg/s
-
write throughput: 4.9 MiB/s
-
write latency: 153.45ms p99 / 6.8ms p95
-
read message rate: 25,073 msg/s
-
read message throughput: 24.5 MiB/s
-
read latency: 57ms p99; 4.91ms p95
-
end-to-end latency5: 186ms p99 / 12ms p95
-
server kept at ~65% CPU;
-
disk was at ~1200 writes/s with iostat claiming 46 MiB/s
Now these are astonishing results! Throughput was not impacted at all. Latency increased but not extremely. Our p99 e2e latency 3x’d (60ms vs 185ms), but the p95 barely moved from 10.6ms to 12ms.
This shows that a simple 3-node Postgres cluster can pretty easily sustain what is a very common Kafka workload - 5 MB/s ingest and 25 MB/s egress. Not only that, but for a cheap cost too. Just $11,514 per year.16
Typically, you’d expect Postgres to run more expensive than Kafka at a certain scale, simply because it wasn’t designed to be efficient for this use case. Not here though. Running Kafka yourself would cost the same. Running the same workload through a Kafka vendor will cost you at least $50,000 a year. 🤯
By the way, in Kafka it’s customary to apply client-side compression on your data. If we assume your messages were 5 KB in size and your clients applied a pretty regular compression ratio of 4x17 - Postgres is actually handling 20 MB/s ingress and 100 MB/s egress.
96 vCPU Single Node
Ok, let’s see how far Postgres will go.
The results are the average of three 2-minute tests. [full results link]
Setup:
- c7i.24xlarge (96 vCPU, 192 GiB RAM) Postgres server instance /w 250GB io2 12,000 IOPS EBS volume
- modified Postgres settings (
huge_pageson, other settings scaled to match the machine);- still kept fsync & synchronous_commit on for durability.
autovacuum_analyze_scale_factor = 0.05set on the partition tables too (unclear if it has an effect)
- each row’s payload is 1 KiB (1024 bytes)
- 30 topicpartition tables
- 100 writers (~3.33 writers per partition on average)
- 5x read fanout via 5 consumer groups
- 150 reader clients total (5 readers per group)
- write batch size: 200 records
- read batch size: 200 records
Results:
-
write message rate: 243,000 msg/s
-
write throughput: 238 MiB/s
-
write latency: 138ms p99 / 47ms p95
-
read message rate: 1,200,000 msg/s
-
read message throughput: 1.16 GiB/s
-
read latency: 24.6ms p99
-
end-to-end latency5: 853ms p99 / 242ms p95 / 23.4ms p50
-
server kept at ~10% CPU (basically idle);
-
bottleneck: The bottleneck was the write rate per partition. It seems like the test wasn’t able to write at a higher rate than 8 MiB/s (8k msg/s) per table with this design. I didn’t push further, but I do wonder now as I write this - how far would writes have scaled?
- Reads were trivial to scale. Adding more consumer groups was trivial - I tried with 10x fanout and still ran at low CPU. I didn’t include it because I didn’t feel the need to push to an unrealistic read-fanout extreme.
240 MiB/s ingress and 1.16 GiB/s egress are pretty good! The 96 vCPU machine was overkill for this test - it could have done a lot more, or we could have simply opted for a smaller machine. For what it’s worth, I do think it’s worth it to deploy a separate Kafka cluster at this scale. Kafka can save you a lot of money here because it can be more efficient in how it handles cross-zone network traffic with features like Diskless Kafka.
Pub-Sub Test Summary
The summarized table with the three test results can be found here → 👉 stanislavkozlovski/pg-queue-pubsub-benchmark
These tests seem to show that Postgres is pretty competitive with Kafka at low scale.
You may have noticed none of these tests were particularly long-running. From my understanding, the value in longer-running tests is to test table vacuuming in Postgres, as that can have negative performance effects. In the pub-sub section, vacuuming doesn’t apply because the tables are append-only. My other reasoning for running shorter tests was to keep costs in check and not spend too much time18.
In any case, no benchmark is perfect. My goal wasn’t to indisputably prove $MY_CLAIM. Rather, I want to start a discussion by showing that what’s possible is likely larger than what most people assume. I certainly didn’t assume I’d get such good numbers, especially with the pub-sub part.
PG as a Queue
In Postgres, a queue can be implemented with SELECT FOR UPDATE SKIP LOCKED. This command selects an unlocked row and locks it. It also skips reading already-locked rows. That’s how mutual exclusion is achieved - a worker can’t get other workers’ jobs.
Postgres has a very popular pgmq library that offers a slick queue API. To keep it simple and understand the end-to-end flow better, I decided to write my own queue. The basic version of it is very easy. My workflow is:
- add job (
INSERT) - lock row & take job (
SELECT FOR UPDATE SKIP LOCKED) - process job (
{your business logic}) - mark job as “done” (
UPDATEa field orDELETE & INSERTthe row into a separate table)
Postgres competes with RabbitMQ, AWS SQS, NATS, Redis19 and to an extent Kafka20 here.
Queue Setup
Table
We use a simple queue table. When an element is processed off the queue, it’s moved into the archive table.
CREATE TABLE queue (
  id BIGSERIAL PRIMARY KEY,
  payload BYTEA NOT NULL,
	created_at TIMESTAMP NOT NULL DEFAULT NOW()
)

CREATE TABLE queue_archive (
  id BIGINT,
  payload BYTEA NOT NULL,
  created_at TIMESTAMP NOT NULL, -- ts the event was originally created at
  processed_at TIMESTAMP NOT NULL DEFAULT NOW() -- ts the event was processed at
)
Writes
We again run N writer client goroutines.
Each one simply loops and sequentially inserts a single random item into the table:
INSERT INTO queue (payload) VALUES ($1)It only inserts one message per statement, which is pretty inefficient at scale.
Reads
We again run M reader client goroutines. Each reader loops and processes one message.
The processing is done inside a database transaction.
BEGIN;

SELECT id, payload, created_at
  FROM queue
  ORDER BY id
  FOR UPDATE SKIP LOCKED
  LIMIT 1;

-- Your business code "processes" the message. In the benchmark, it's a no-op.

DELETE FROM queue WHERE id = $1;

INSERT INTO queue_archive (id, payload, created_at, processed_at)
  VALUES ($1,$2,$3,NOW());

COMMIT;
Each reader again only works with one message at a time per transaction.
Queue Results
I again ran the same three setups - a single-node 4 vCPU, a 3-node replicated 4 vCPU and a single-node 96 vCPU setup. Here are the summarized results for each:
4 vCPU Single Node
The results are the average of two 15-minute tests. I also ran three 2-minute tests. They all performed similarly. [full results link]
Setup:
- c7i.xlarge Postgres server /w 25GB gp3 9000 IOPS EBS volume
- all default Postgres settings21
- each row’s payload is 1 KiB (1024 bytes)
- 10 writer clients, 15 reader clients
Results:
- message rate: 2885 msg/s
- throughput: 2.81 MiB/s
- write latency: 2.46ms p99
- read latency: 4.2ms p99
- end-to-end latency5: 17.72ms p99
- server kept at ~60% CPU;
What I found Postgres wasn’t good at was handling client count. The bottleneck in this setup was the read clients. Each client could not read more than ~192 messages a second because of its median read latency and sequential read nature.
Increasing client count boosted throughput but violated my ~60% CPU target. Trying to run 50 write and 50 read clients got to 4000 msg/s without increasing the queue depth but pegged the server’s CPU to 100%. I wanted to keep the benchmarks realistic for what you may run in production, rather than maxing out what a machine can do. This would be easily alleviated with a connection pooler (standard across all prod PG deployments) or a larger machine.
Another thing worth mentioning is that the workload could sustain a lot more writes than reads. If I didn’t throttle the benchmark, it would write at 12,000 msg/s and read at 2,800 msg/s. In the spirit of simplicity, I didn’t debug further and instead throttled my writes to see at what point I could get a stable 1:1 workload.
4 vCPU Tri-Node
A single 10-minute test. [full results link]
Setup:
- 3x c7i.xlarge Postgres servers /w 25GB gp3 9000 IOPS EBS volume
- each on a separate AZ (us-east-1a, us-east-1b, us-east-1c)
- one
syncreplica and onepotential14 replica
- a few custom Postgres settings like
wal_compression,max_worker_processes,max_parallel_workers,max_parallel_workers_per_gatherand of course -hot_standby - each row’s payload is 1 KiB (1024 bytes)
- 10 writer clients, 15 reader clients
- readers only access the primary DB15; readers are in the same AZ as the primary;
Results:
- message rate: 2397 msg/s
- throughput: 2.34 MiB/s
- write latency: 3.3ms p99
- read latency: 7.6ms p99
- end-to-end latency5: 920ms p99 ⚠️6; 536ms p95; 7ms p50
- server kept at ~60% CPU;
As expected, throughput and latency were impacted somewhat. But not that much. It’s still over 2000 messages a second, which is pretty good for an HA queue!
96 vCPU Single Node
The average of three 2-minute tests. [full results link]
Setup:
- c7i.24xlarge Postgres server instance /w 250GB io2 12,000 IOPS EBS volume
- modified Postgres settings (
huge_pageson, other settings scaled to match the machine);- still kept fsync & synchronous_commit on for durability.
- each row’s payload is 1 KiB (1024 bytes)
- 100 writer clients, 200 reader clients
Results:
- message rate: 20,144 msg/s
- throughput: 19.67 MiB/s
- write latency: 9.42ms p99
- read latency: 22.6ms p99
- end-to-end latency: 930ms p99 ⚠️6; 709ms p95; 12.6ms p50
- server at 40-60% CPU;
This run wasn’t that impressive. There is some bottleneck in the single-table queue approach at this scale which I didn’t bother figuring out. I figured that it wasn’t important to reach absurd numbers on a single table, since all realistic scenarios would have multiple queues and never reach 20,000 msg/s on a single one. The 96 vCPU instance would likely scale far further were we to run a few separate queue tables in parallel.
Queue Test Summary
The summarized table with the three test results can be found here → 👉 stanislavkozlovski/pg-queue-pubsub-benchmark
Even a modest Postgres node can durably push thousands of queue ops/sec, which already covers the scale 99% of companies ever hit with a single queue.
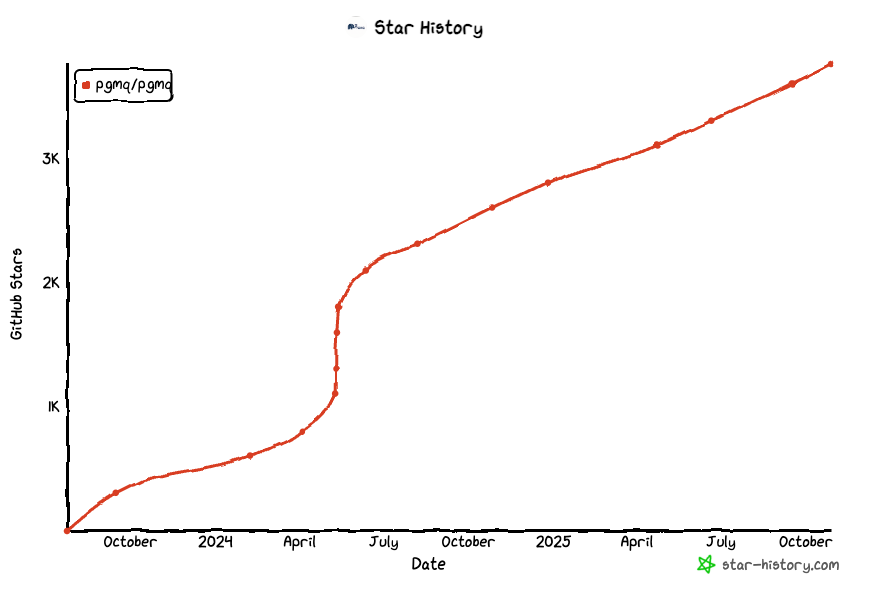
As I said earlier, the last 2 years have seen the Just Use Postgres slogan become mainstream. The pgmq library’s star history captures this trend perfectly:
Should You Use Postgres?
Most of the time - yes. You should always default to Postgres until the constraints prove you wrong.
Kafka is obviously better optimized for pub-sub workloads. Queue systems are obviously better optimized for queue workloads. The point is that picking a technology based on technical optimization alone is a flawed approach. To throw an analogy:
a Formula One car is optimized to drive faster, but I still use a sedan to go to work. I am way more comfortable driving my sedan than an F1 car.
(seriously, see the steering wheel on these things)
The Postgres sedan comes with many quality-of-life comforts that the F1 Kafka does not:
- ability to debug messages with regular SQL
- ability to delete, re-order or edit messages in place
- ability to join pub-sub data with regular tables
- ability to trivially read specific data via rich SQL queries (
ID=54,name="John",cost>1000)
Giving up these comforts is a justified sacrifice for your F1 car to go at 378 kmh (235 mph), but masochistic if you plan on driving at 25kmh (15 mph).
Donald Knuth warned us in 1974 - premature optimization is the root of all evil. Deploying Kafka at small scale is premature optimization. The point of this article is to show you that this “small scale” number has grown further than what people remember it to be - it can comfortably mean many megabytes per second.
We are in a Postgres Renaissance for a reason: Postgres is frequently good enough. Modern NVMEs and cheap RAM allow it to scale absurdly high.
What’s the alternative?
Custom Solutions for Everything?
Naive engineers tend to adopt a specialized technology at the slightest hint of a need:
- Need a cache? Redis, of course!
- Search? Let’s deploy Elasticsearch!
- Offline data analysis? BigQuery or Snowflake - that’s what our data analysts used at their last job.
- No schemas? We need a NoSQL database like MongoDB.
- Have to crunch some numbers on S3? Let’s use Spark!
A good engineer thinks through the bigger picture.
- Does this new technology move the needle?
- Is shaving a few milliseconds off our query worth the extra organizational complexity introduced with the change?
- Will our users notice?
At small scale, these systems hurt you more than they benefit you. Distributed systems - both in terms of node count and system cardinality - should be respected, feared, avoided and employed only as a weapon of last resort against particularly gnarly problems. Everything with a distributed system becomes more challenging and time-consuming.
The problem is the organizational overhead. The organizational overhead of adopting a new system, learning its nuances, configs, establishing monitoring, establishing processes around deployments and upgrades, attaining operational expertise on how to manage it, creating runbooks, testing it, debugging it, adopting its clients and API, using its UI, keeping up with its ecosystem, etc.
All of these are real organizational costs that can take months to get right, even if the system in question isn’t difficult (a lot are). Managed SaaS offerings trade off some of the organizational overhead for greater financial costs - but they still don’t remove it all. And until you reach the scale where the technology is necessary, you pay these extra {financial, organizational} costs for zero significant gain.
If the same can be done with tech for which you’ve already paid the organizational costs for (e.g Postgres), adopting something else prematurely is most definitely an anti-pattern. You don’t need web-scale technologies when you don’t have web-scale problems.
MVI (a better alternative)
What I think is a better approach is to search for the minimum viable infrastructure (MVI): build the smallest amount of system while still providing value.
- choose good-enough technology your org is already familiar with
- good-enough == meets your users’ needs without being too slow/expensive/insecure
- familiar == your org has prior experience, has runbooks/ops setups, monitoring, UI, etc
- solve a real problem with it
- use the minimum set of features
- the fewer features you use, the more flexibility you have to move off the infra in question in the future (e.g if locked in with a vendor)
Bonus points if that technology:
- is widely adopted so finding good engineers for it is trivial (Postgres - check)
- has a strong and growing network effect (Postgres - check)
The MVI approach reduces the surface area of your infra. The fewer moving parts you have, the fewer failure modes you worry about and the less glue code you have to maintain.
Unfortunately, it’s human nature to go against this. Just like startups suffer due to MVP bloat (one more feature!), infra teams suffer due to MVI bloat (one more system!)
Why are we like this?
I won’t pretend to be able to map out the exact path-dependent outcome, but my guess is this:
- the zero interest rate era gave us abundant speculative money that was invested in any company that could grow fast
- a lot of viral internet companies were growing at speeds that led old infra to become obsolete fast
- this prompted the next wave of ZIRP investment - specialized data infrastructure companies (in a gold rush, sell shovels!); some of these data infra startups spun off directly from the high-growth companies themselves
- each well-funded data infra vendor is financially motivated to evangelize their product and have you adopt it even when you don’t need to (Everyone is Talking Their Book). They had deep pockets for marketing and used them.
- innovative infrastructure software got engineered. It was exciting - so engineers got nerd-sniped into it
- a web-scale craze/cargo cult developed, where everybody believed they need to be able to scale from zero to millions of RPS because they may go viral any day.
- a trend developed to copy whatever solutions the most successful, largest digital-native companies were using (Amazon, Google, Uber, etc.)
- the trend became a self-perpetuating prophecy: these technologies became a sought-after skill on resumes
- system design interview questions were adapted to test for knowledge of these systems
- within an organization, engineers (knowingly or not) pushed for projects that are exciting and helped build their resumes;
This trend continues to grow while there is no strong competing force that is sufficiently motivated to push the opposite view. Even engineers inside a company, who ought to be motivated to keep things simple, have strong incentives to pursue extra complexity. It benefits their career by giving them a project to use as ammo for their next promotion and improves their resume (cool tech/story on there) for their next job-hop. Plus it’s simply more fun.
This is why I think we, as an industry, don’t always use the simplest solution available.
In most cases, Postgres is that simplest solution that is available.
But It Won’t Scale!
I want to wrap this article up, but one rebuttal I can’t miss addressing is the “it won’t scale argument”.
The argument goes something like this: “in today’s age we can go viral at a moment’s notice; these viral moments are very valuable for our business so we need to aggressively design in a way that keeps our app stable under traffic spikes”
I have three arguments against this:
1. Postgres Scales
As of 2025, OpenAI still uses an unsharded Postgres architecture with only one primary instance for writes22. OpenAI is the poster-child of rapid viral growth. They hold the record for the fastest startup to reach 100 million users.
Bohan Zhang, a member of OpenAI’s infrastructure team and co-founder of OtterTune (a Postgres tuning service), can be quoted as saying23:
“At OpenAI, we utilize an unsharded architecture with one writer and multiple readers, demonstrating that PostgreSQL can scale gracefully under massive read loads.”
“The main message of my talk was that if you are not too write heavy, you can scale Postgres to a very high read throughput with read replicas using only a single master! That is exactly the message that needs to be spelled out as that covers the vast majority of apps.”
“Postgres is probably the default choice for developers right now. You can use Postgres for a very long time. If you are building a startup with read-heavy workloads, just start with Postgres. If you hit a scalability issue, increase the instance size. You can scale it to a very large scale. If in the future the database becomes a bottleneck, congratulations. You have built a successful startup. It’s a good problem to have.”
(slightly edited for clarity and grammar)
Despite their rapid growth to a user base of more than 800 million, OpenAI has still NOT opted for a web-scale distributed database. If they haven’t… why does your unproven project need to?
2. You Have More Time To Scale Than You Think
Let’s say it’s a good principle to design/test for ~10x your scale. Here are the years of consistent growth rate it takes to get to 10x your current scale:
| annual growth | years to hit 10× scale |
|---|---|
| 10 % | 24.16 y |
| 25 % | 10.32 y |
| 50 % | 5.68 y |
| 75 % | 4.11 y |
| 100 % | 3.32 y |
| 150 % | 2.51 y |
| 200 % | 2.10 y |
It goes to show that even at extreme growth levels, you still have years to migrate between solutions. The majority of developers, though, work at companies in the 0-50% growth rate. They are more likely to have moved on to another job by the time the solution needs to change (if ever).
3. It’s Overdesign
In an ideal world, you would build for scale and any other future problem you may hit in 10 years.
In the real world, you have finite bandwidth, so you have to build for the most immediate, highest ROI problem.
Commenter snej on lobste.rs captured it well:
Planning your infrastructure around being able to handle that is sort of like buying a huge Marshall stack as your first guitar amp because your garage band might get invited to open for Coldplay.
Postgres isn’t meant to be the guaranteed permanent replacement anyway. It’s just the easiest and best starting point - it gives you a simple stack, helps you retain flexibility and increase velocity.
When the bottlenecks (feature-wise or scale-wise) reveal themselves, you start addressing them one by one and deciding at each step - “do I migrate to a purpose-built solution?“.
Conclusion
Just use Postgres until it breaks.
Disclaimers
-
Title inspiration comes from a great recent piece - “Redis is fast - I’ll cache in Postgres”
-
I’m a complete Postgres noob. You may see a lot of dumb mistakes here. Feel free to call me out on them - I’m happy to learn. I used AI to help a lot with some of the PG tools to use. This both shows how inexperienced I am in the context and how easy it is to start. I am generally skeptical of AI’s promise (in the short-term), but there’s no denying it has made a large dent in democratizing niche/low-level knowledge.
If you’d like to reach out to me, you can find me on LinkedIn or X (Twitter).
Post-Editorial Note
This post blew up on Hacker News and Lobsters. It got a lot of approval and some pushback. Let me address some of the most important things:
What I believe is misunderstood
- ⁉️ mixing pub-sub/queue workloads with regular OLTP workloads risks breaking the main DB (e.g from some nasty transactions)
- ✅ use a different DB instance! yes, you lose transactionality b/w pub-sub/queue data and regular data, but still retain all the other benefits and reduce the risk of impact.
- ⁉️ Kafka is not a queue!
- 🙂 yes, it is not. There are a fair amount of articles online that are misguided and compare Postgres to Kafka in the context of a queue. This article compares Postgres to Kafka in the context of a pub-sub, and Postgres to other queueing technologies (not Kafka). Although Kafka is merging a queue feature, so it will become such soon.
- ⁉️ Kafka scales better!
- 🤨 Yes. Did you read the article?
- ⁉️ Kafka isn’t hard to manage, especially if you use a SaaS.
- 🙂 I didn’t make an argument about operational overhead. Both systems can have operational overhead, or can be easy to deal with — it all depends on your expertise and deployment model (e.g how close to capacity are you).
- I don’t think Kafka is particularly hard to manage despite what most marketing says. I don’t think Postgres is hard to manage either. But if, all else equal, I have to choose between managing two systems or one, I’d choose to manage one type of system. At a certain requirement threshold, I’d choose to manage two.
- ⁉️ Kafka has many features that Postgres doesn’t.
- 🙂 Somewhat true. My point is that most people don’t truly need 80%+ of them. And in that case - you don’t need Kafka. But there aren’t THAT features. I went over some of them here.
- ⁉️ Purpose-built technology is more efficient. Postgres performs comparatively atrociously with so much CPU.
- 🙂 Yes, that’s true. But it doesn’t matter. You shouldn’t care about efficiency until it becomes a scale or a cost concern. In the same way I don’t write my web server in Rust so as to be the most performant possible, I don’t need to deploy my pubsub with Redpanda so as to use the least CPU. PG is good enough and gives you the ability to scale 10-100x up to even 200+ MB/s as shown here. When you reach a point where it’s time to migrate, you migrate.
What I believe is easy to fix
- ⁉️ Postgres can’t handle lots of data for a prolonged period because it’ll fill the disk!
- ✅ 100%. This was a real miss w.r.t pub-sub, because if you e.g consistently push 10 MB/s on Postgres and want to retain that data for 7 days, you’d need 5.8TB of disk on that primary!
- This can be alleviated with some archival job. In my tests, I assumed this exists.
- Thankfully,
pg_lakereleased a few days ago. It seems to enable you to easily offload PG data into S3 in an Iceberg format. If you pairpg_lakewith an imaginarypg_pubsubextension (which I hope somebody builds), it becomes very similar to Kafka’s Tiered Storage feature which alleviates the issue.
- ⁉️ You want me to rebuild Kafka?
- 🙂 I don’t want you to rebuild Kafka, but I want someone to do it. It would be a lot of work if every company had to re-implement pub-sub on top of Postgres, but if a single person did it in an extension and it caught on — that’d be great. Hence I think somebody should do it!
- I truly don’t think it’s that much work. The concepts are simple. When you aren’t building a distributed system, aren’t chasing high efficiency/scale nor the most complex features - it becomes a pretty easy task. Log-based pub-sub is incredibly simple if you think about it.
- We have seen so many projects rebuild Kafka from scratch8, why wouldn’t we rebuild it on what is perhaps the most ubiquitous infrastructure product in the world? 🐘
- ⁉️ You want me to rebuild Kafka clients?
- 🙂 It’s good to separate the discussion between clients and server. The server operational aspect (scale, features) is what I was mostly focusing on in this article. I argue that from an infrastructure perspective, modern Postgres and hardware is already good enough and doesn’t require changes. From a client-perspective, code needs to be written in order to create abstractions that present a pub-sub like experience and prevent people from shooting themselves in the foot. This already exists for queues already via
pg_mq(and others).
- 🙂 It’s good to separate the discussion between clients and server. The server operational aspect (scale, features) is what I was mostly focusing on in this article. I argue that from an infrastructure perspective, modern Postgres and hardware is already good enough and doesn’t require changes. From a client-perspective, code needs to be written in order to create abstractions that present a pub-sub like experience and prevent people from shooting themselves in the foot. This already exists for queues already via
Where I believe Kafka > Postgres
-
🏆 Schema Evolution
- Kafka via Schema Registry has versioned schemas, meaning different messages in the same log can have different versions of the schema. Postgres has one schema per table at any one time.
- Schema Registry therefore makes schema evolution without breaking consumers/producers easier. This makes upgrades a lot easier - you don’t need to think as carefully about what client you need to upgrade first. This then enables you to better decouple publishers from subscribers, which is a core reason for using Kafka in the first place.
- But… chances are if you’re using Postgres you’re already forced to deal with its schema evolution limitations. In certain architectures, that OLTP data source could be the bottleneck re: schemas, in which case getting stronger flexibility downstream isn’t that impactful. Depends on your architecture and use-case, basically.
- Also, Kafka isn’t perfect regarding schemas either. Most notably, there is no server-side validation. One bad client can break your topic for all consumers. Kafka also doesn’t allow single-message deletion, only “delete up to this message”. Some Kafka implementations like Bufstream sought out to fix this.
-
🏆 Network effect (the Kafka API). Kafka has rich connectivity - every tool supports it. It has Kafka Connect. Postgres doesn’t!
- This is true. I have myself written that Kafka was created in order to streamline connectivity to other systems. Postgres obviously doesn’t have that rich an ecosystem - it was never meant as a data integration tool.
- The Kafka client network effect is really, really hard to topple. I wouldn’t dare argue that. My point is that it doesn’t matter as much in the context of “Just Use Postgres”. If you’re pursuing a MVI-like approach to data infra and have chosen to use Postgres instead of Kafka, chances are you don’t have 20 overkill big data technologies you need to sink your data to. This therefore diminishes the value of connectivity.
- There are ways around this too, like archiving the data to S3 in an Iceberg table format via
pg_lake. The Iceberg movement seems to be competing with Kafka on data integration, at least somewhat. - Another interesting compromise is to run a Kafka API proxy in front of Postgres. This, in theory, lets you painlessly migrate to real Kafka if you ever need to. Tansu is an open-source Rust project that enables this. This approach comes with extra complexity though, which negates parts of my arguments in the article.
In the end, I still strongly believe there is serious value in bundling Kafka into Postgres. Oracle already did it with their database.
Footnotes
-
Don’t worry if you don’t fully understand these terms. I work full-time in the industry that spews these things and I don’t have a great grasp either. It’s marketing slop. ↩
-
Gartner and others push embarrassing recommendations that aren’t tech driven. It’s frequently the opposite - they’re profit driven. Gartner makes $6.72B purely off a consulting service that charges organizations $50k per seat solely for access to reports that recommend these slop architectures. It’s not crazy to believe, hence many people are converging with the idea that it is a pay-to-win racket model. ↩
-
Seriously, the improvement in hardware is something I find most senior engineers haven’t properly appreciated. Newest gen AMD CPUs boast 192 cores. Modern SSDs can do 5.5 million random reads a second, or ~28GB/s sequential reads. Both are a 10-20x improvement over the last 10 years alone. Single nodes are more powerful than ever. ↩
-
Just in the last 6 months - Snowflake acquired Crunchy Data for ~$250M, Databricks acquired Neon for ~$1 billion; In the last 12 months, Supabase more than 5x’d its valuation from ($900M to $5B), raising $380M across three series (!!!). Within a single year! ↩
-
End-to-end latency here is defined as
now() - event_create_time; In essence, it tracks how long a brand new persisted event takes to get consumed. It helps show cases where queue lag spikes like when consumers temporarily fall behind the write rate. ↩ ↩2 ↩3 ↩4 ↩5 ↩6 ↩7 -
Some queue tests showed higher E2E latencies which I believe was due to a bug. In the pub-sub tests, I ensured readers start before the writers via a 1000ms sleep. For the queue tests, though, I didn’t do this. The result is that queue tests immediately spike queue depth at startup because the writers manage to get a head start before the readers. I believe the E2E latency is artificially high because of this flaw in the test. ↩ ↩2 ↩3 ↩4
-
Actually, things are ordered in the happy path. Only during retries can you get out of order processing. e.g at t=0, client A reads task N; At t=1, client B reads task N+1 and processes it successfully; At t=2, A fails and is unable to process task N; At t=3, client B takes the next available task - which is N. B therefore executes the tasks in order [N+1, N], whereas proper order would have been [N, N+1] ↩
-
Open-source projects include Apache Pulsar (open source), RedPanda (source-available), AutoMQ (a fork of Kafka) and a lot of proprietary offerings - AWS Kinesis, Google Pub/Sub, Azure Event Hubs, Confluent Kora, Confluent WarpStream, Bufstream to name a few. What’s common in 90% of these projects is that they all implement the Apache Kafka API, making Kafka undoubtedly the protocol standard in the space. There’s also an open-source project which exposes a Kafka API on top of a pluggable Postgres or S3 backend - Tansu (Rust, btw :] ) ↩ ↩2
-
The most popular library I could find is pg-pubsub with 106 stars as of writing (Oct 2025). Its last commit was 3 months ago. ↩
-
Batching messages per client is very important for scalability here. It is one of Kafka’s least-talked-about performance “tricks”. ↩
-
These tables act as different log data structures. You can see them as separate topics, or partitions of one topic (shards). ↩
-
Postgres stores all
NOTIFYevents in a single, global queue. If this queue becomes full, transactions callingNOTIFYwill fail when committing. (src) ↩ -
A report by RedPanda found that ~55% of respondents use Kafka for < 1 MB/s. Kafka-vendor Aiven similarly shared that 50% of their Kafka deployments have an ingest rate of below 10 MB/s. ↩
-
This replication is equivalent to RF=2 in Kafka with one extra non-synchronous replica. Call it RF=2.5. The client receives a response when the one
syncreplica confirms the change. The otherpotentialreplica is replicating asynchronously without blocking the write path. It will become promoted tosyncif the other one was to die. ↩ ↩2 -
The tests didn’t direct any read traffic to the standbys. This caused extra load on the primary - most production workloads would read from the standbys. Despite that, the results were still good! In my tests, I found that the extra read workload didn’t seem to have a negative effect on the database - it seems such tail reads were served exclusively from cache. ↩ ↩2
-
The node and its disk cost $1826 per year. Since we run three of those, it’s $5478/yr. The networking in AWS costs $0.02/GB and our setup is replicating 4.9MB/s across two instances - that results in 294.74TB cross-zone networking per year. That’s $6036 per year in replication networking. Assuming your clients are in the same zone as the database they’re writing to / reading from, that networking is free. That results in an annual cost of $11,514. ↩
-
We can realistically achieve a 10x+ compression ratio if operating on compressible data like logs (something Kafka is used for frequently). The only gotcha is that we need to compress larger batches - eg 25KB+ - so that requires a bit of a re-design in the pub-sub data model. ↩
-
I had already spent enough business days working on this benchmark and re-running tests numerous, numerous times as I iterated on the benchmark and the methodology. On the larger instances, the cost accumulates fast and running longer tests at high MB/s rates requires deploying much larger and more expensive disks in order to store all the accumulated data. The effort spent matches the goal I have with the article. If any Postgres vendor wants to sponsor a more thorough investigation - let me know! ↩
-
Surprisingly (to me), Redis is a very popular queue-like backend choice for background jobs. Most popular open-source libraries use it. Although I’m sure Postgres can do just as good a job, many devs will prefer to use an established library rather than build one from scratch or use something less well-maintained. I do think PG-backed libraries should get developed though! ↩
-
Kafka has historically never been a queue. To use it as one, you had to develop some difficult workarounds. Today, however, it is in the middle of implementing a first-class Queue-like interface (currently in Preview) ↩
-
Most importantly, synchronous commit and fsync are both on. This means every write is durably persisted to disk. ↩
-
The optimizations they did to support this scale are cool, but not novel. See these two talks at a) PGConf.dev 2025 (my transcript) and b) POSETTE (my transcript) ↩
-
From the talks PGConf.dev 2025 (my transcript) and POSETTE (my transcript) ↩